If you run finance or revenue operations for a SaaS company, you already know the surface-level pain: HubSpot’s native deal pipeline tells you when a contract closes, but it cannot show you what happens to that contract afterward. Upgrades, downgrades and churn get buried in ticket notes or never logged at all. The result is a foggy picture of Annual Recurring Revenue (ARR) that forces teams back to spreadsheets every month end.
This post explains how one high-growth SaaS client solved that gap. By adding three custom objects, a handful of Python-powered workflows and a set of focused dashboards, they turned HubSpot into a revenue command center that satisfies auditors and empowers RevOps at the same time.
Why Native HubSpot Falls Short
-
Deals stop at Closed Won. Subsequent expansion or contraction lives in separate deals that rarely reconcile cleanly with the original customer record.
-
Stripe and product data sit outside HubSpot. Finance must export CSVs and hope naming conventions line up.
-
No immutable change log. Without a single source of truth, recreating ARR by quarter becomes a forensic project instead of a query.
Auditors, board members and FP&A teams need a GAAP-friendly waterfall that shows beginning ARR, plus or minus every change, and ending ARR. HubSpot’s out-of-the-box schema cannot deliver that view.
The Object Model That Fixes the Problem
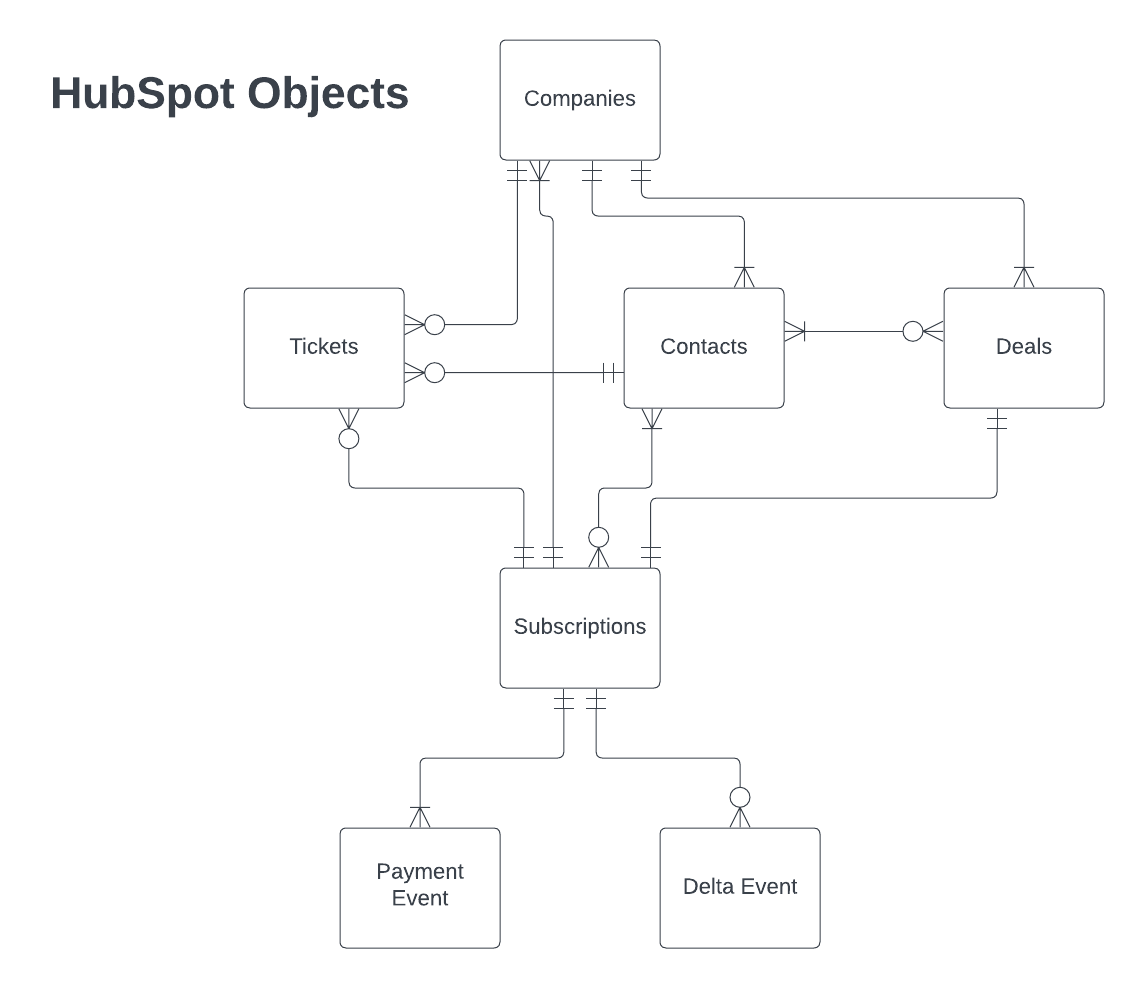
The cornerstone of the solution is a lightweight data model, visualized in the HubSpot Objects ERD screenshot.

Three new objects join native Companies, Contacts and Deals:
-
Subscription – one record per active plan, with fields for tier, start date, next payment date and ARR.
-
Payment Event – every Stripe invoice syncs here for cash reconciliation.
-
Delta Event – the hero object. Each upgrade, downgrade or churn is captured with old ARR, new ARR and Net ARR Change.
Because Delta Events attach directly to Subscriptions, finance can roll changes up to the company or deal level with a single filter in HubSpot reports.
How the Data Flows
Below the objects is a closed-loop workflow driven by HubSpot Operations Hub and a private app key.
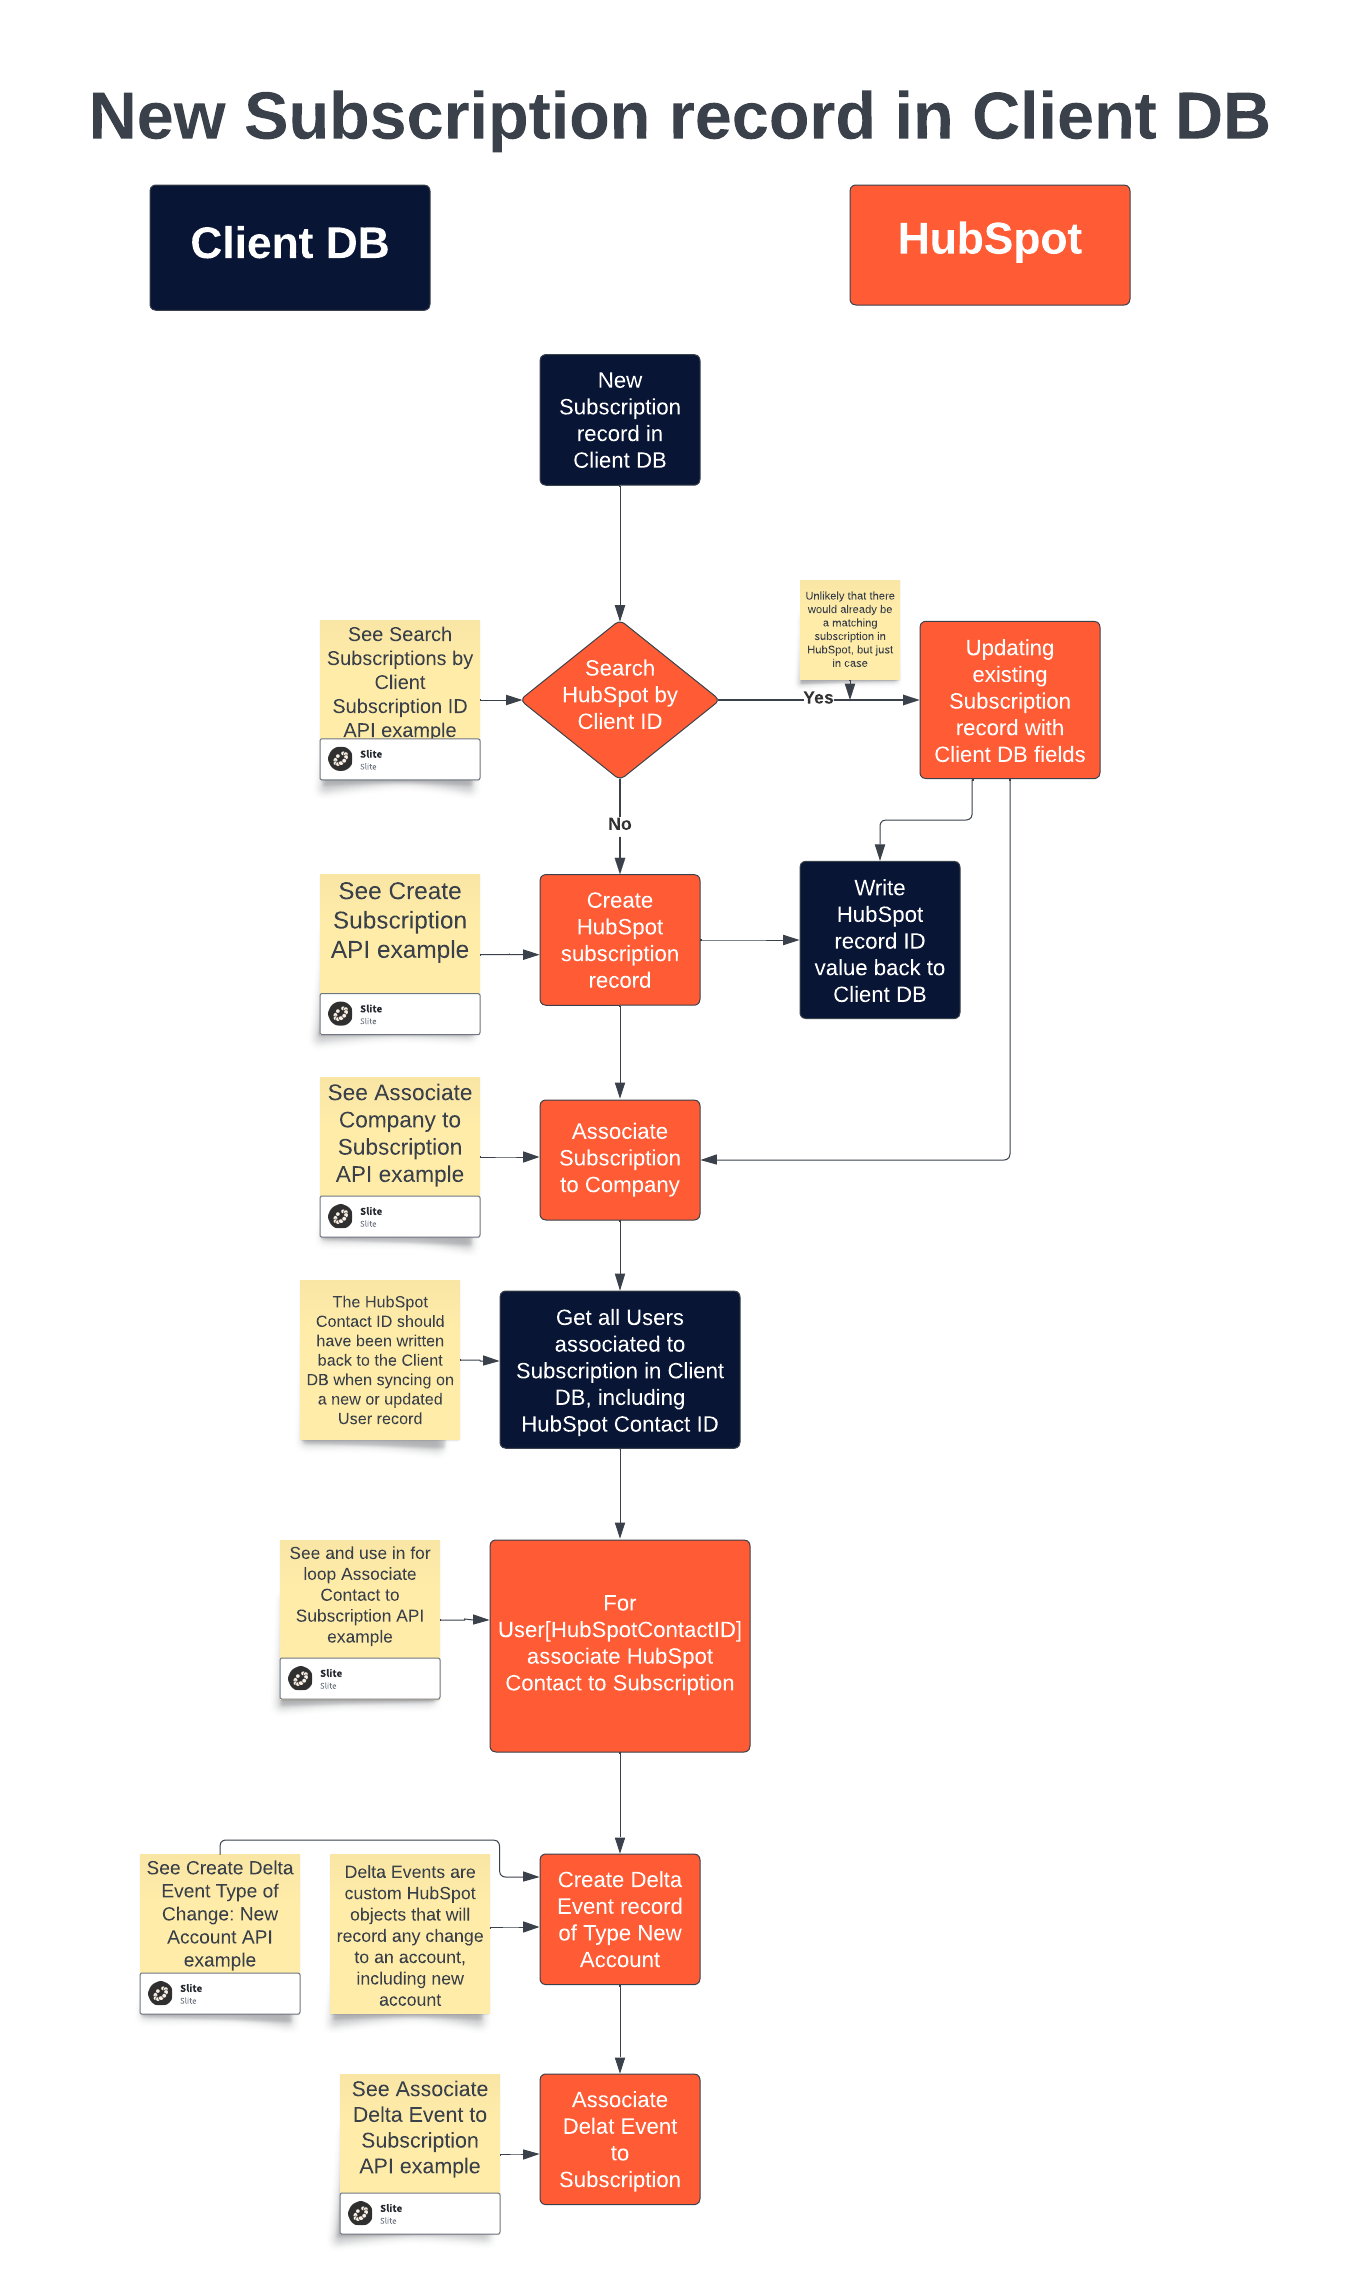
-
Detect change in product database or Stripe webhooks.
-
Query HubSpot for matching Subscription. If none exists, create it.
-
Write a Delta Event that stores before-and-after values.
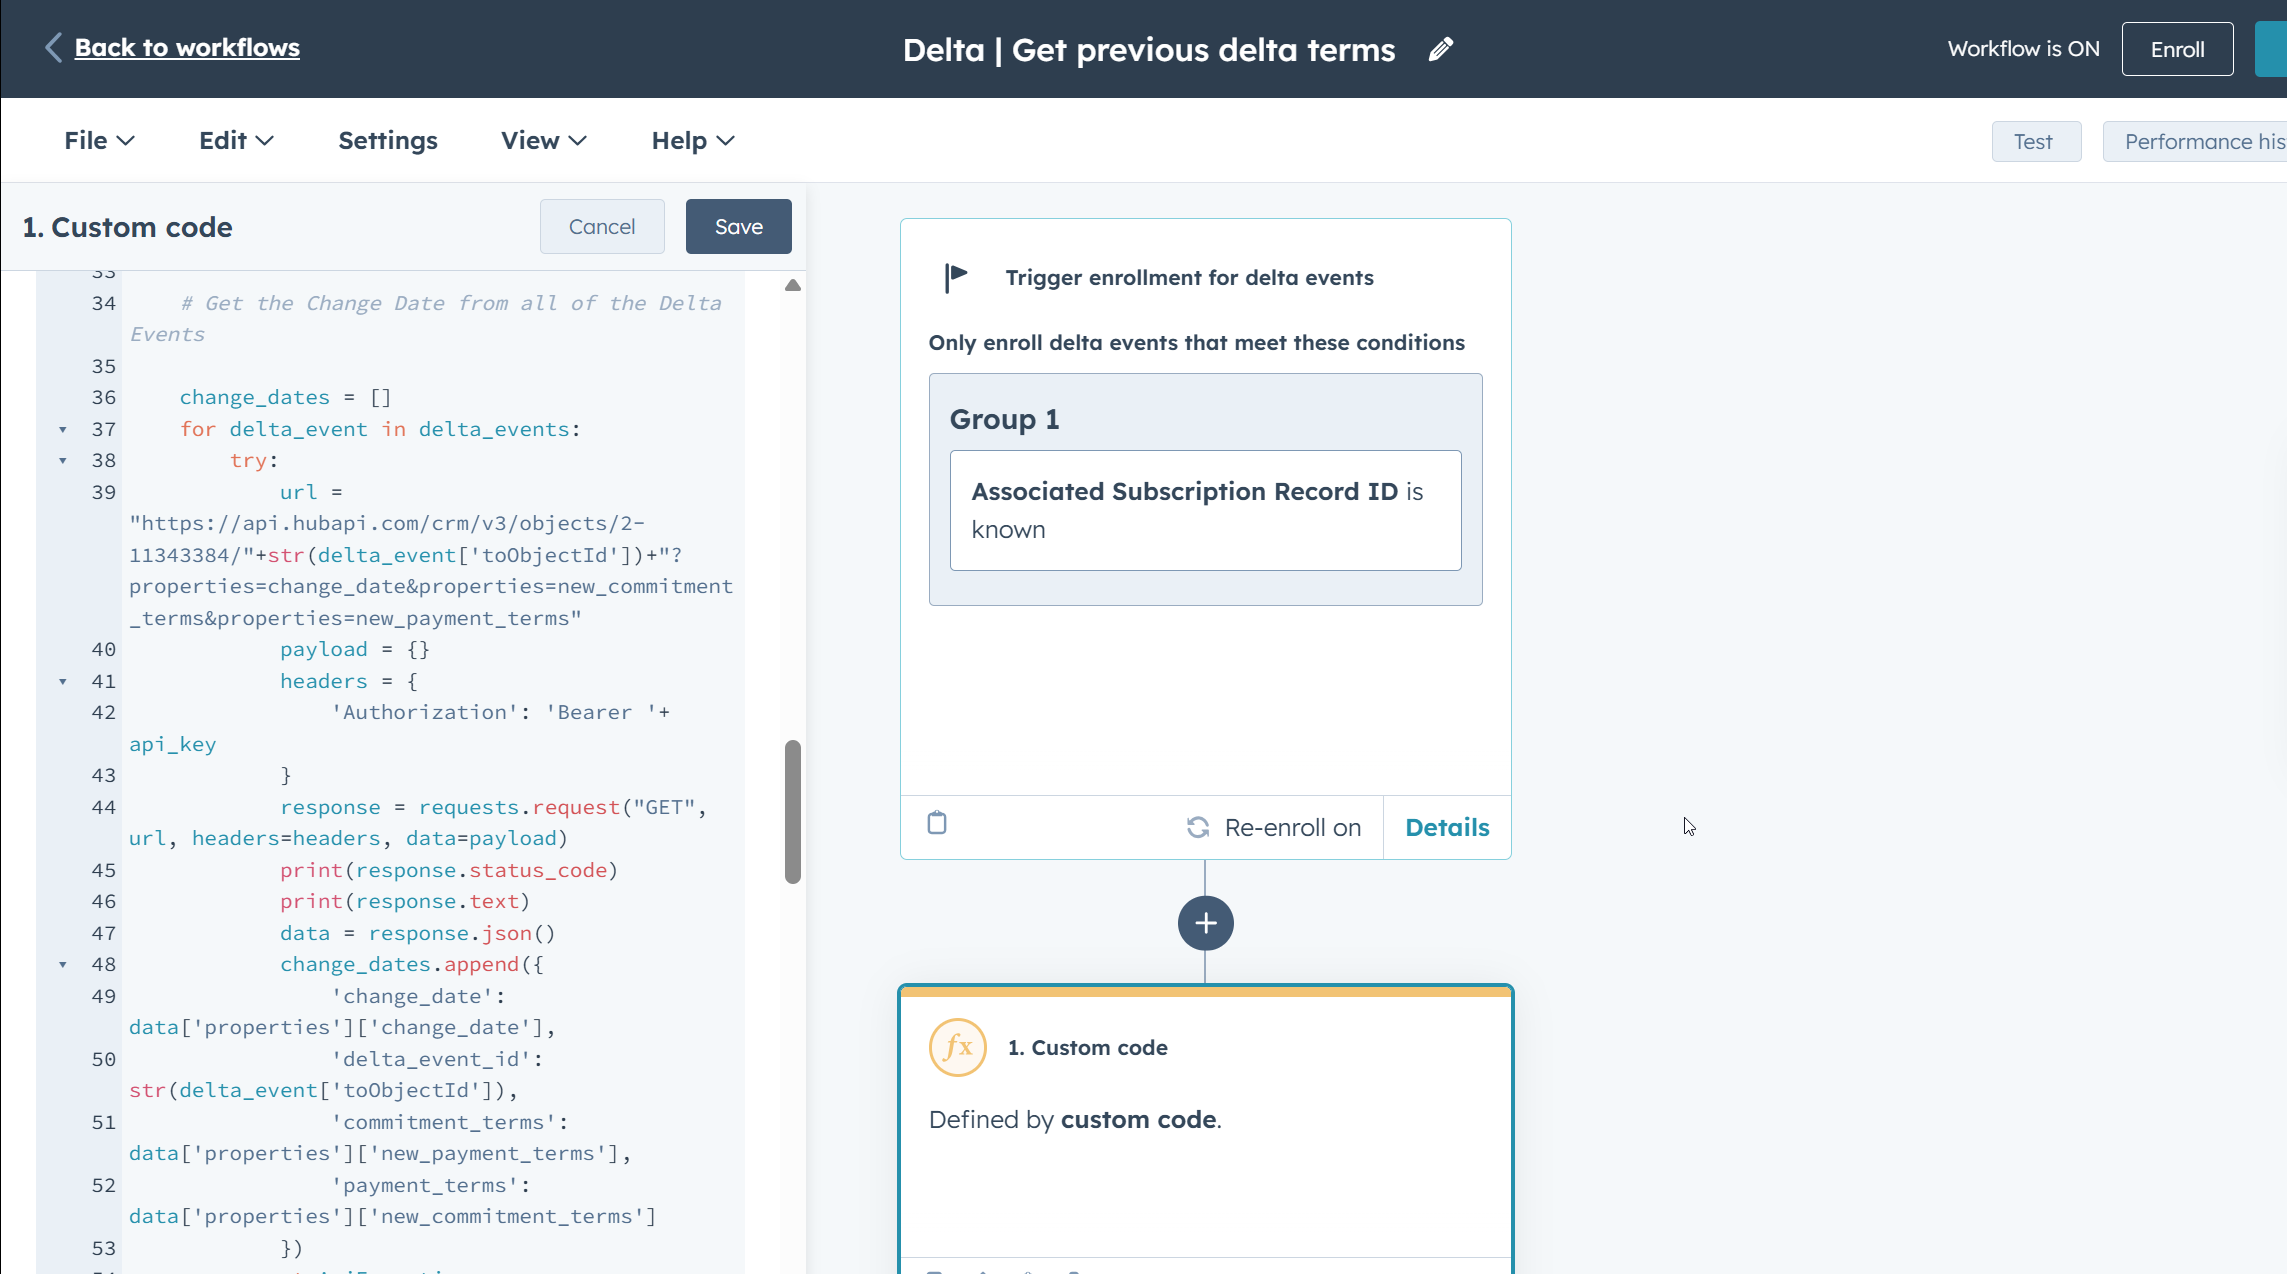
-
Fire a Python action that enriches the Delta Event with legacy terms, ensuring a full audit trail.
Every action runs inside HubSpot, so end users never leave the CRM to see a revenue change.
Dashboards That Pass the “Board Deck” Test
With data flowing, reporting becomes simple. The ARR Change by Quarter chart shows:
-
Stacked bars for new ARR, expansion, contraction and churn.
-
A running sum of Net ARR Change to date.
-
Filters for customer cohort, product tier and sales influence.
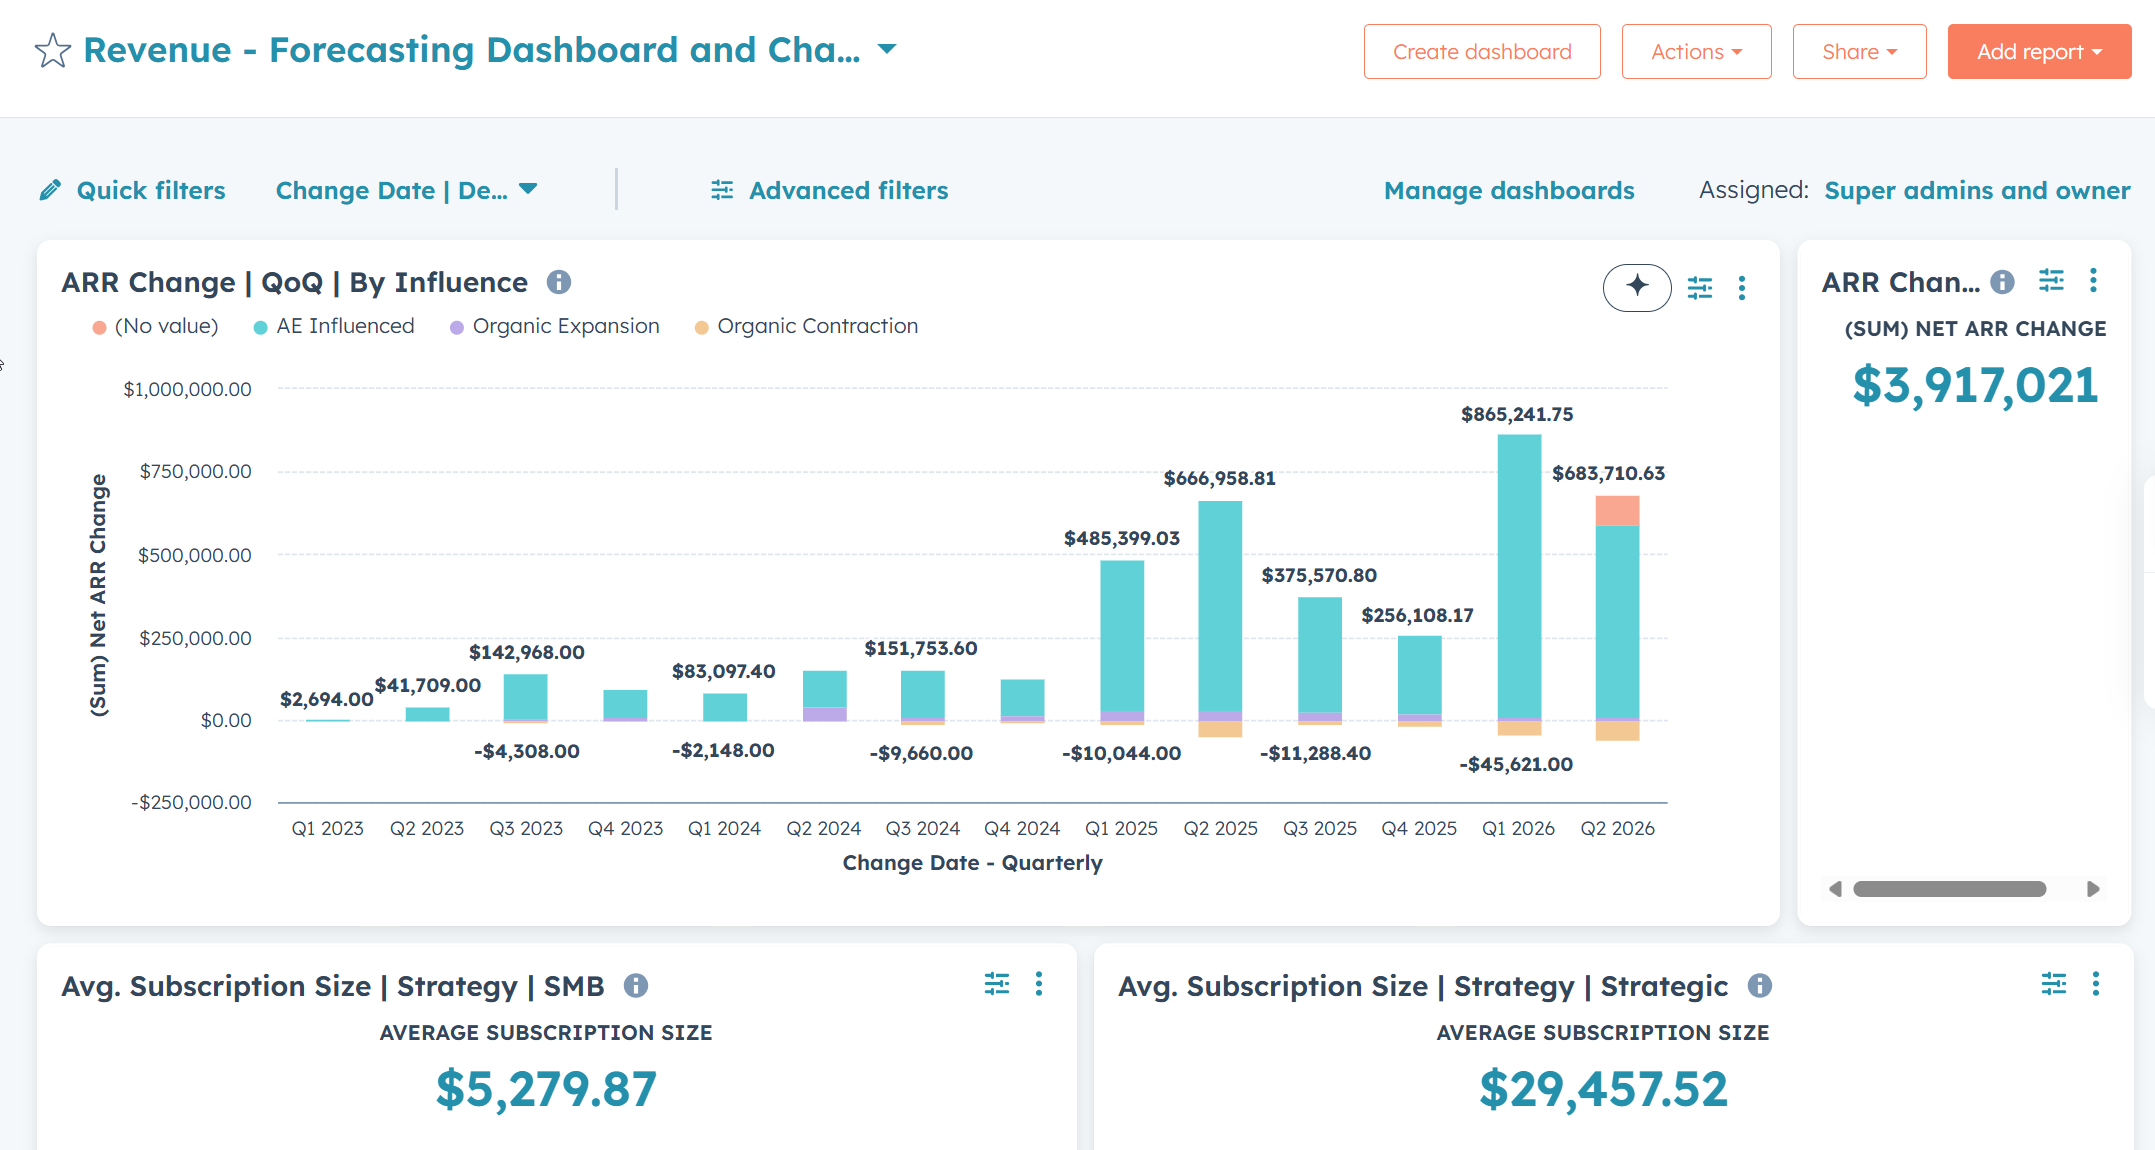
The CFO now exports a board-ready slide in two clicks rather than building a 12-tab spreadsheet.
Quantifiable Results
| Metric | Before | After | Improvement |
|---|---|---|---|
| Month-end close time | 2 business days | 2 hours | 75 % faster |
| Manual exports per month | 10+ CSVs | 2 flat files (backup only) | 80 % reduction |
| Net ARR under management | — | 3.9 million dollars | Full visibility |
Lessons for Finance and RevOps Teams
-
Model revenue, not deals. HubSpot can track renewals and mid-term changes when you treat revenue as its own object hierarchy.
-
Make change events immutable. Auditors need to see an untouched record of what happened. Delta Events provide that ledger.
-
Keep everything in one platform. Users adopt the system when they never have to leave it to get answers.
Implementation Checklist
-
Map existing Stripe plans and product SKUs to Subscription fields.
-
Build or update webhooks to push creation and updates of Subscriptions and Delta Events.
-
Create Operations Hub custom-code actions to backfill historical terms.
-
Design dashboards for ARR Change, Average Subscription Size and Churn Rate.
-
Train RevOps and Customer Success on how to read Delta Events in the timeline view.
A typical mid-market implementation takes four weeks from kickoff to live dashboards.
Ready to See It in Action?
Watch the four-minute walkthrough video at the top of this post, then book a discovery call. We’ll model your own data inside a sandbox and prove the reporting lift in a single session.